


Website Traffic Control
See who visits your Odoo website and backend, from where, spot hostile visitors — and block them.
Every request that reaches Odoo is logged with its country, device and result. Explainable rules give each IP address a threat score. Login brute force is blocked automatically; everything else waits for your approval. One dashboard, 10 analyses, 3 PDF reports.
Website Owners
Odoo Administrators
Security Officers
Marketing & Analytics
Odoo Partners & Hosts

Why This Module
Odoo tells you what your customers bought, not who knocked on the door. A standard installation keeps no usable record of which addresses hit your login page ten thousand times last night, or which country your traffic comes from.
Odoo's own login cooldown lives in the memory of each worker process. With several workers an attacker simply gets several times the attempts, and nothing is recorded. Here the counters live in the database: one count for the whole server, and a block that survives a restart.
Nothing is decided by a black box. An IP is judged by named rules you can read, switch off and re-weight, each hit is stored with its evidence, and blocking anything but login brute force needs a human to approve it.
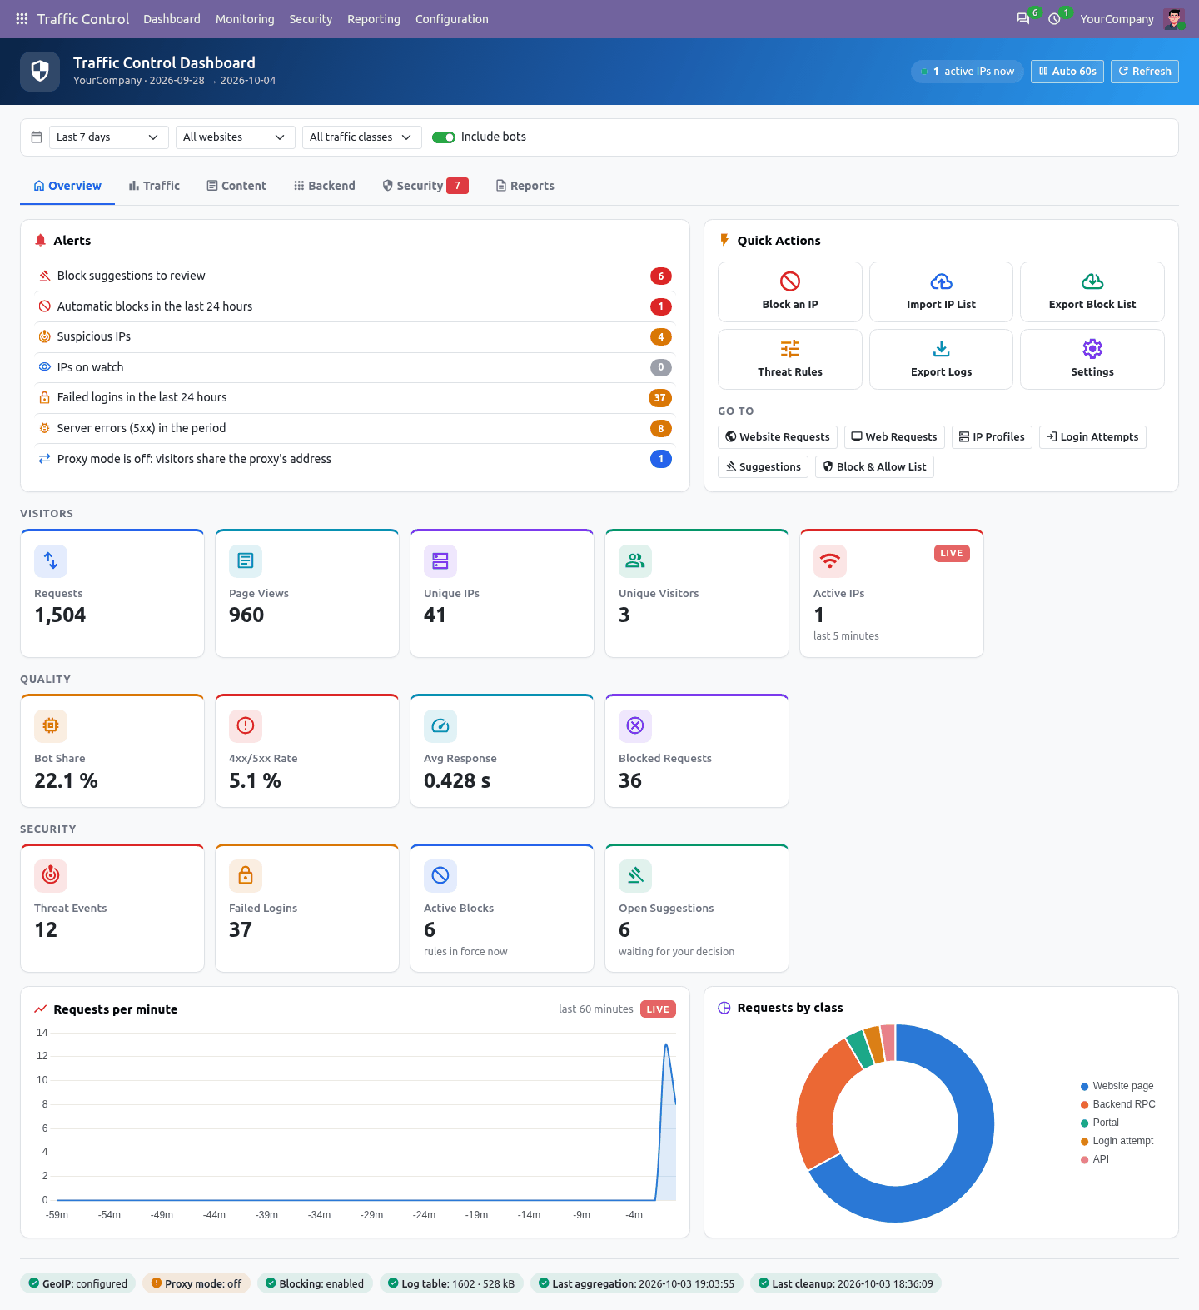
The dashboard — six tabs, 13 KPI tiles, live charts, an alert board and role-aware Quick Actions. Every tile opens the records behind it.
Request Log
Every request that reaches Odoo: time, IP, method, path, status, duration, size, referrer, browser, website, user and visitor. Split into Website Requests and Web Requests, each with a plain-words description such as “Contact: list records”.
Geolocation
Country, region, city, coordinates and timezone per IP, through Odoo's built-in GeoIP (MaxMind GeoLite2). ISP and ASN when you supply the ASN database. A clear “GeoIP not configured” notice instead of wrong data.
IP Profiles
One profile per address: first and last seen, requests, pages, 404s, failed logins, threat score and status (normal, watch, suspicious, blocked, allowed), with its events, login attempts, rules and a chatter.
Threat Scoring
16 rules: probes for foreign software, path traversal, SQL injection and XSS patterns, scanner tools, 404 bursts, path enumeration, high request rate, fake search bots and a honeypot. Scores decay with a 24-hour half-life.
Block Suggestions
A score above 60 raises a suggestion with its reason and evidence. Block for a chosen time, Watch, Allow-list or Dismiss — one by one, in bulk, or in one click from the dashboard. Every decision is logged.
Login Protection
Every attempt recorded, on the login form and on XML-RPC, JSON-RPC and API keys. 10 failures or 5 different logins in 10 minutes block the IP, escalating 15 min → 1 h → 24 h. Passwords are never stored.
Block & Allow Lists
By IP, CIDR range, country, user-agent pattern or path. Block (403), throttle (429) or log only; whole site, login only, website only or backend only; with start, expiry and reason. The allow list always wins.
Backend Usage
Which app, action, model and record each internal user opens. The backend is a single-page app, so a small web-client service reports each navigation that server logs alone cannot see.
Privacy Built In
IP masking or keyed hashing, sanitised query strings, optional hashed logins, retention per data type with batched cleanup, and a “Forget this IP” tool for data-subject requests.
How You Actually Use It — Step by Step
Ten jobs, in the order you meet them: two to set up, eight you come back to.
Set it up — once
Configuration → Settings. Sensible defaults ship with the module, so five minutes is enough.
Run Odoo behind your reverse proxy with proxy_mode on, so the real visitor address is seen. The status block tells you whether it is.
Point geoip_city_db / geoip_country_db at the GeoLite2 files and press Test GeoIP.
Choose what to log, how long to keep it, and whether to mask or hash IP addresses.
Thresholds, login limits, escalation durations, block-page text and notifications are all on this one page.
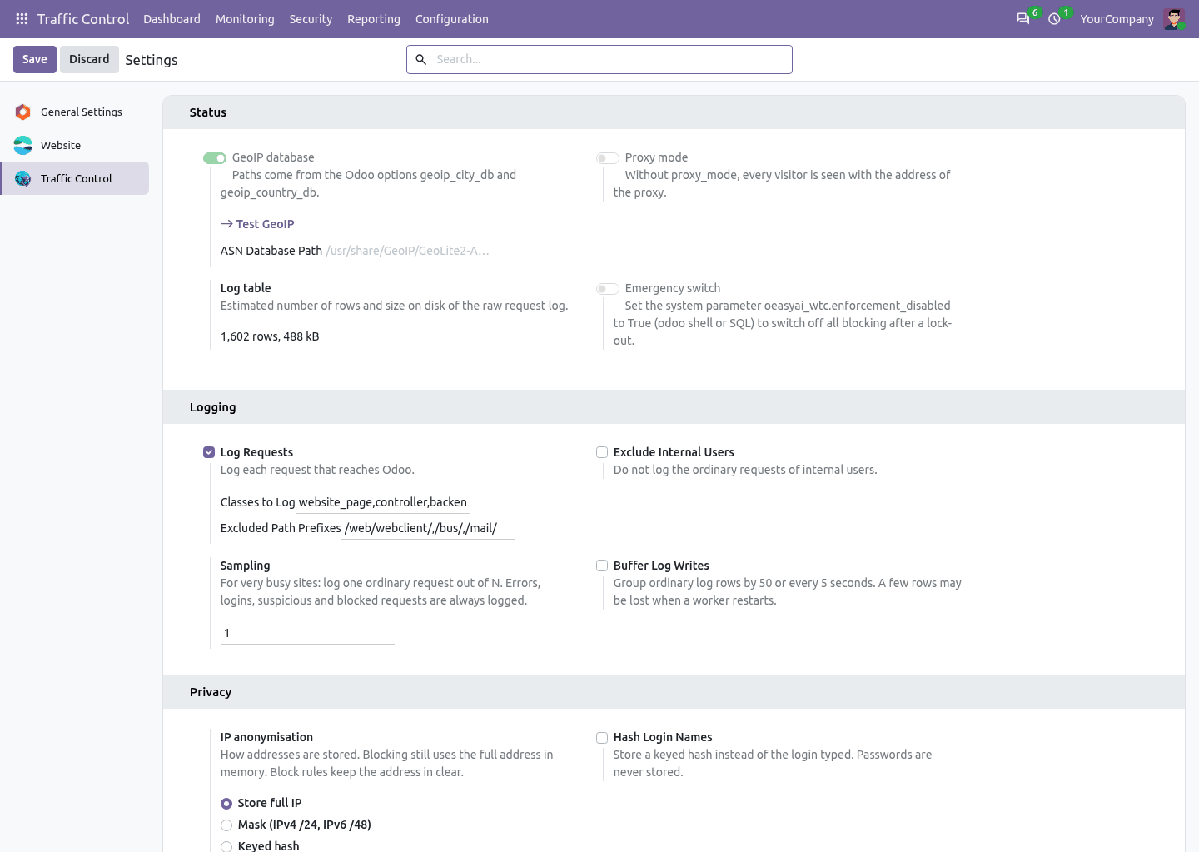
Every policy on one page
Give each person a role
Settings → Users. Viewer, Analyst or Manager — each includes the one before.
Viewer: dashboard and summary reports, no individual IP.
Analyst: requests, IP profiles, login attempts, events; can mark a suggestion Watch or Dismiss.
Manager: blocks, unblocks, allow-lists, edits rules and settings.
Read the dashboard
Open Traffic Control. The Overview tab puts what needs you first, then the figures.
Alerts: suggestions to review, automatic blocks, suspicious IPs, failed logins, server errors and configuration problems.
13 KPI tiles with the change against the previous period; a LIVE tile and a live requests-per-minute chart.
Filter by period, website and traffic class; include or exclude bots. Auto-refresh every 60 seconds, pausable.
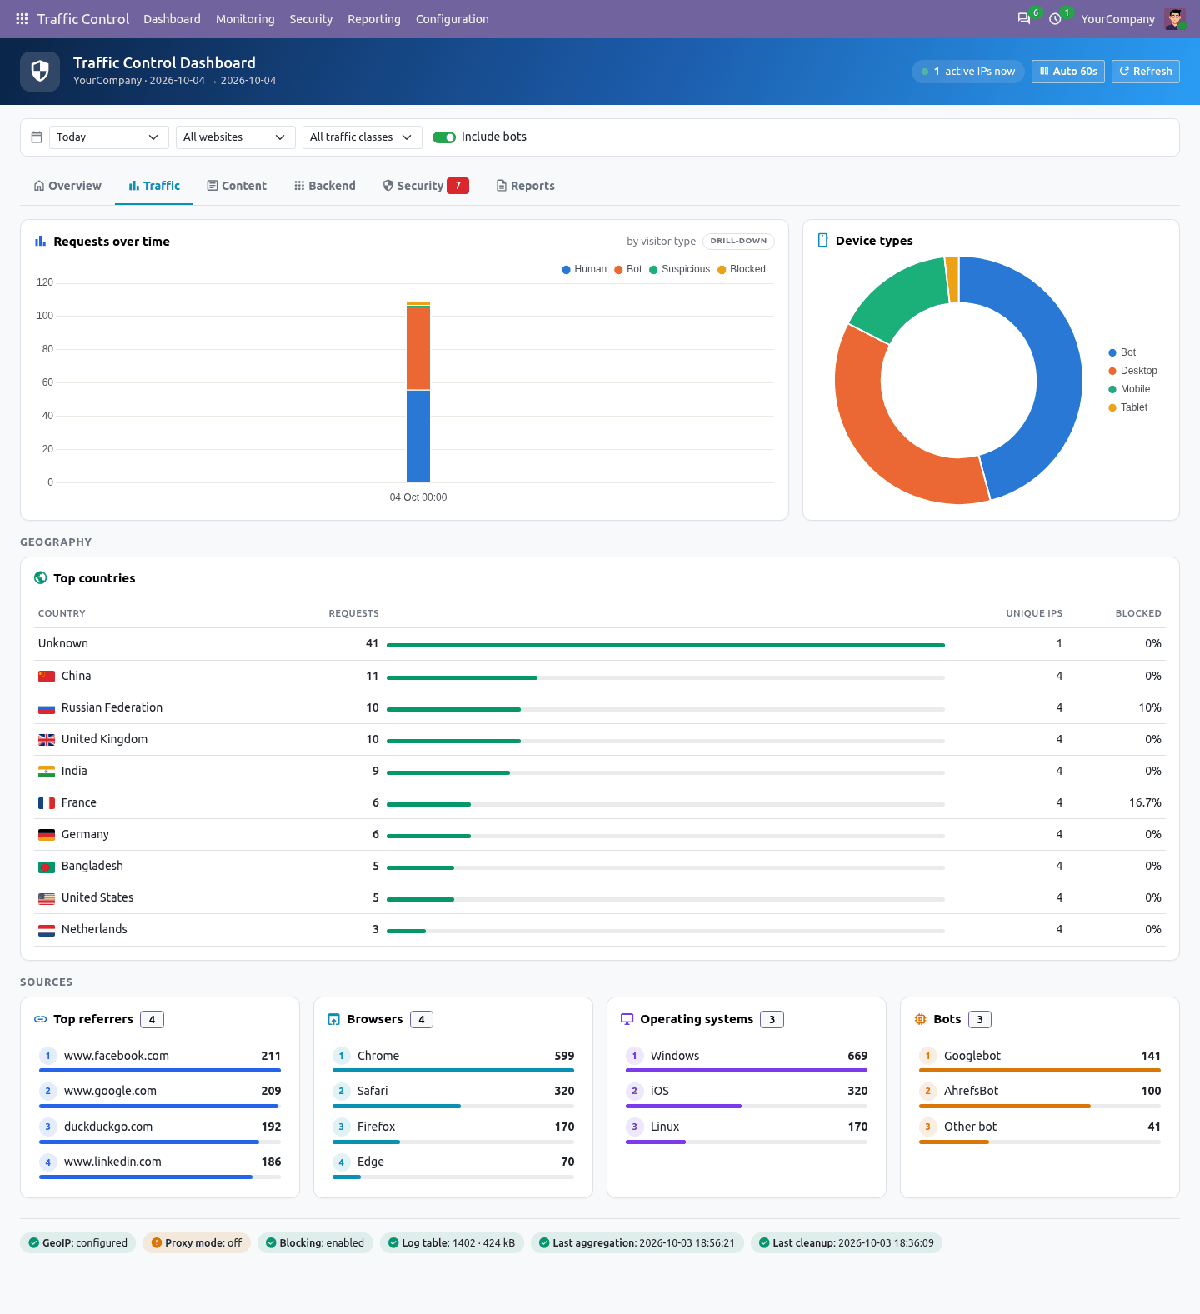
Traffic tab: visitor types, devices, countries, referrers, browsers, systems and bots
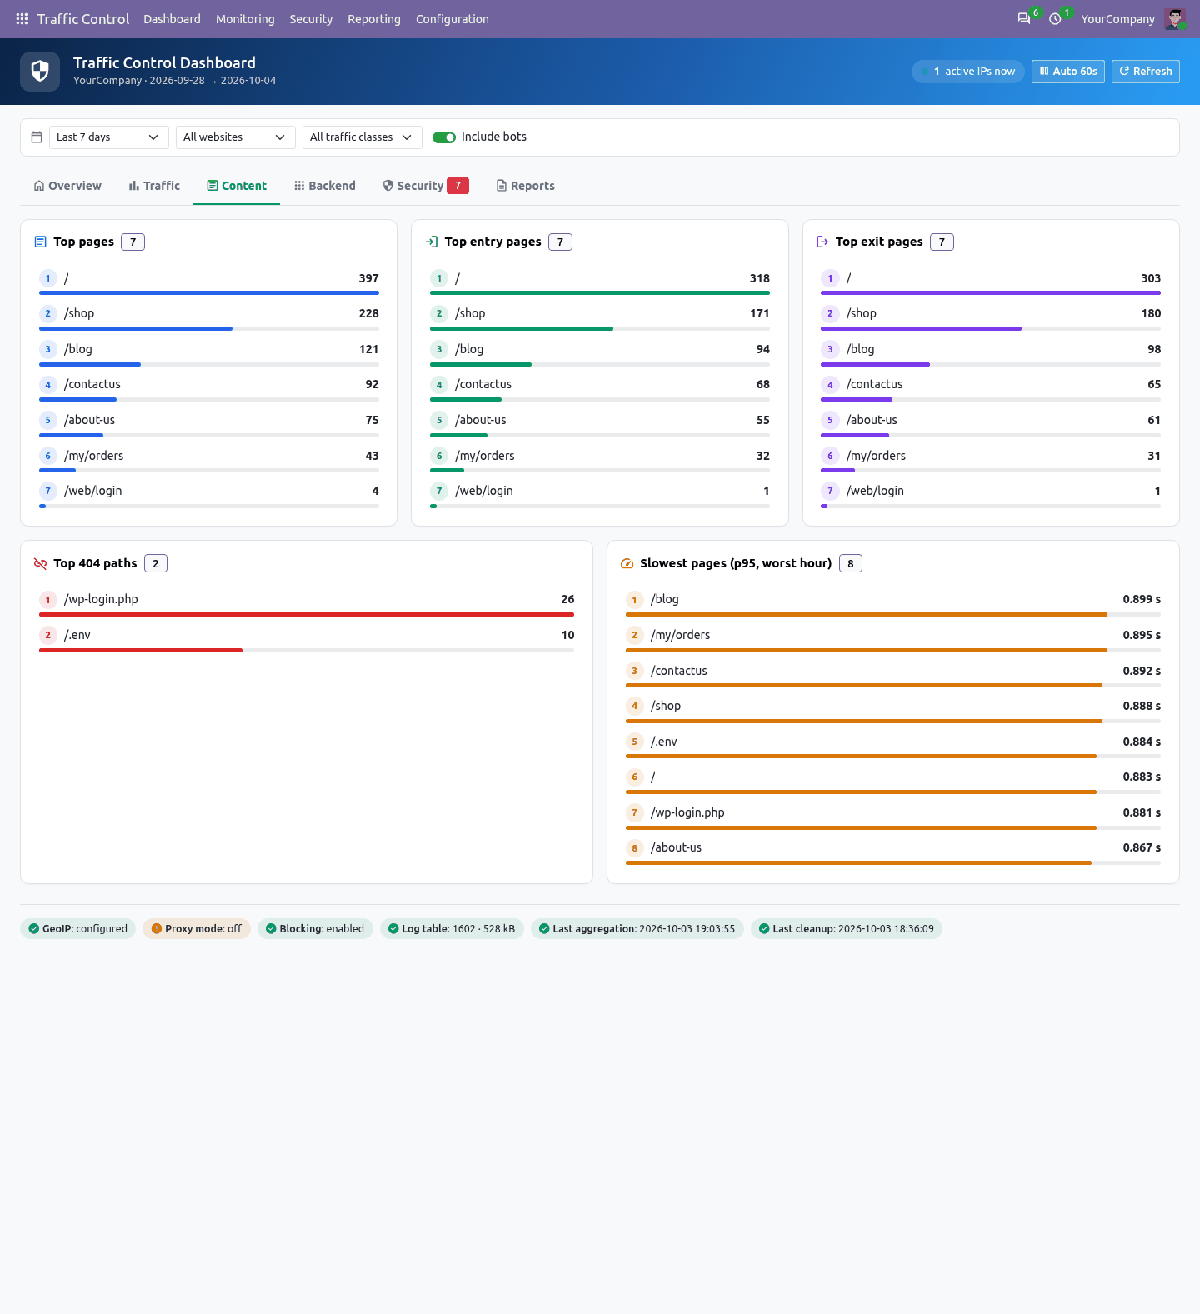
Content tab: top, entry and exit pages, 404s and slowest pages
Look at the requests
Monitoring → Website Requests and Web Requests.
The Request column says what was asked in plain words; the technical path sits beside it.
Blocked lines are red, suspicious ones orange, errors grey. Duration is in seconds.
Filter by blocked, suspicious, errors, 404, class; group by IP, path, status, user or day.
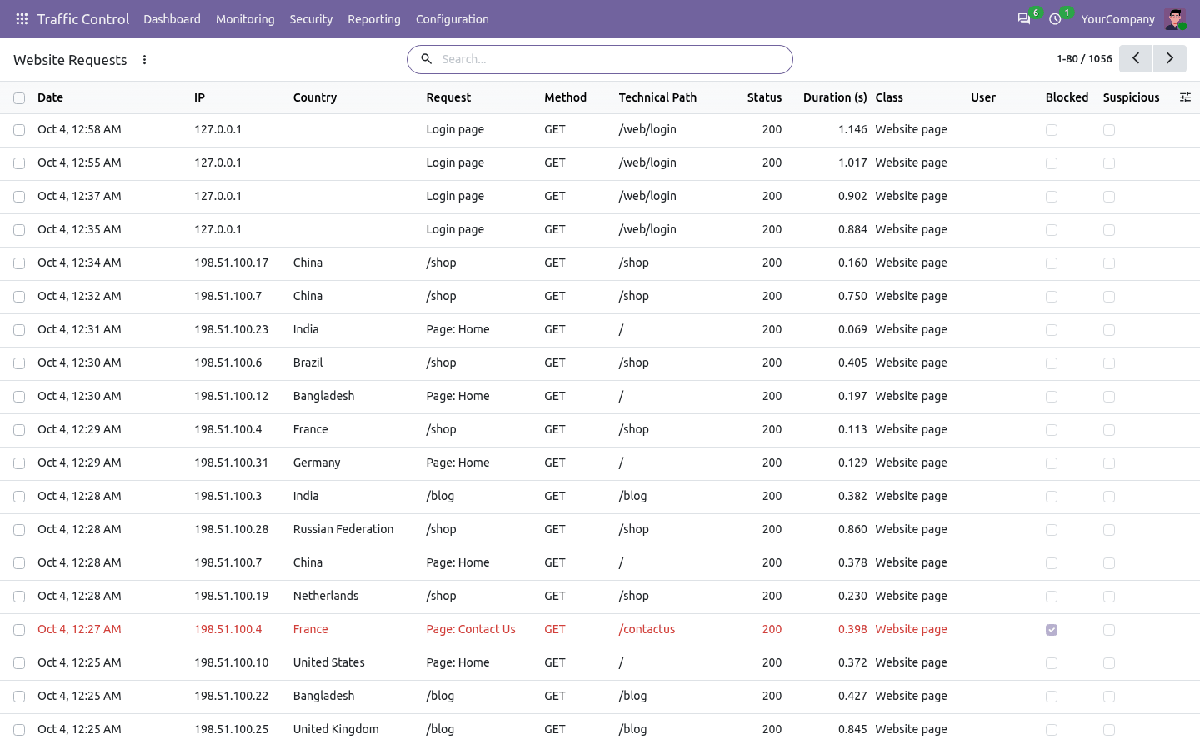
Website Requests
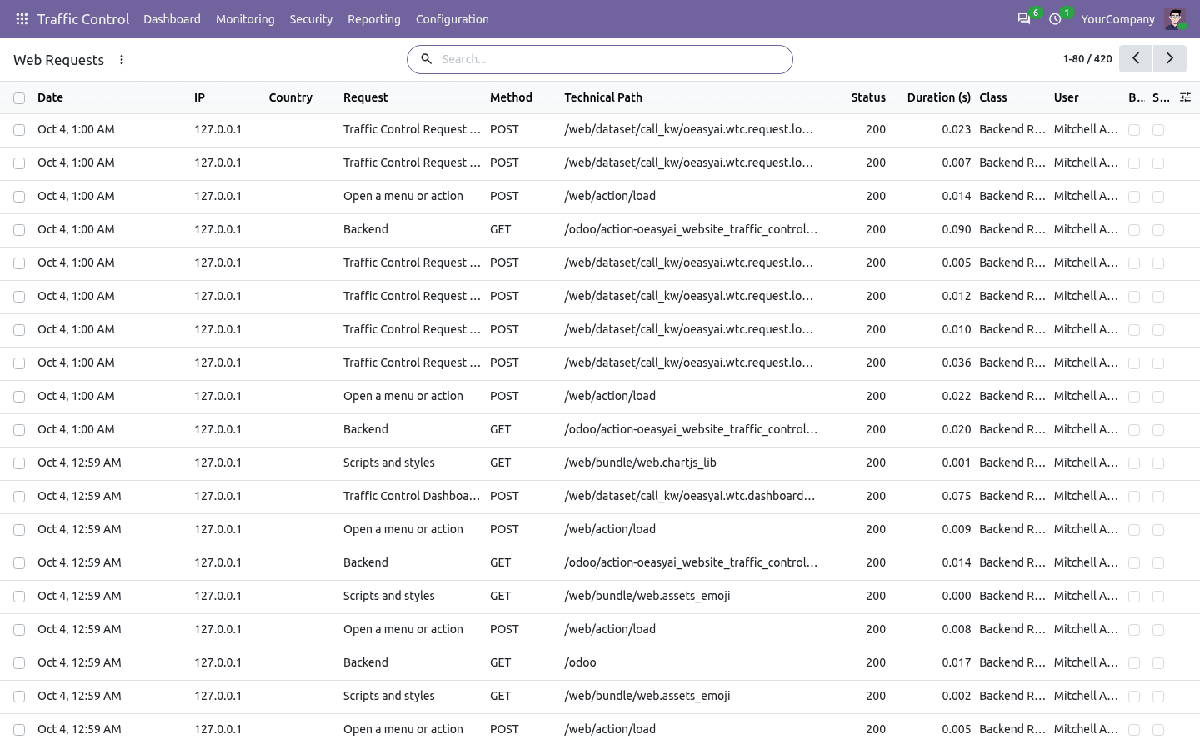
Web Requests: backend, login and API calls
Open an IP profile
Monitoring → IP Profiles. Everything about one address on one page.
Location, ISP, activity totals, threat score and status.
Tabs for its threat events, login attempts and rules; a chatter for notes and automatic-block messages.
Buttons: Block, Unblock, Watch, Refresh Location, Forget this IP — and a printable Security Incident Report.
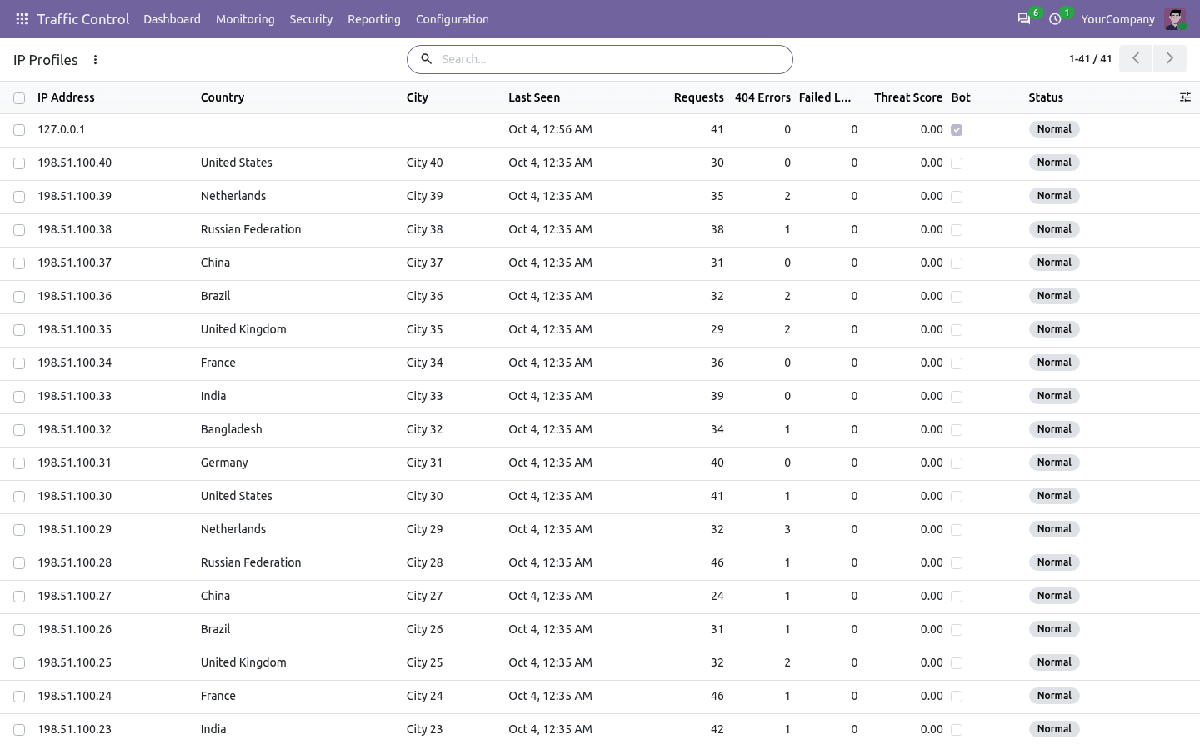
IP Profiles, coloured by status
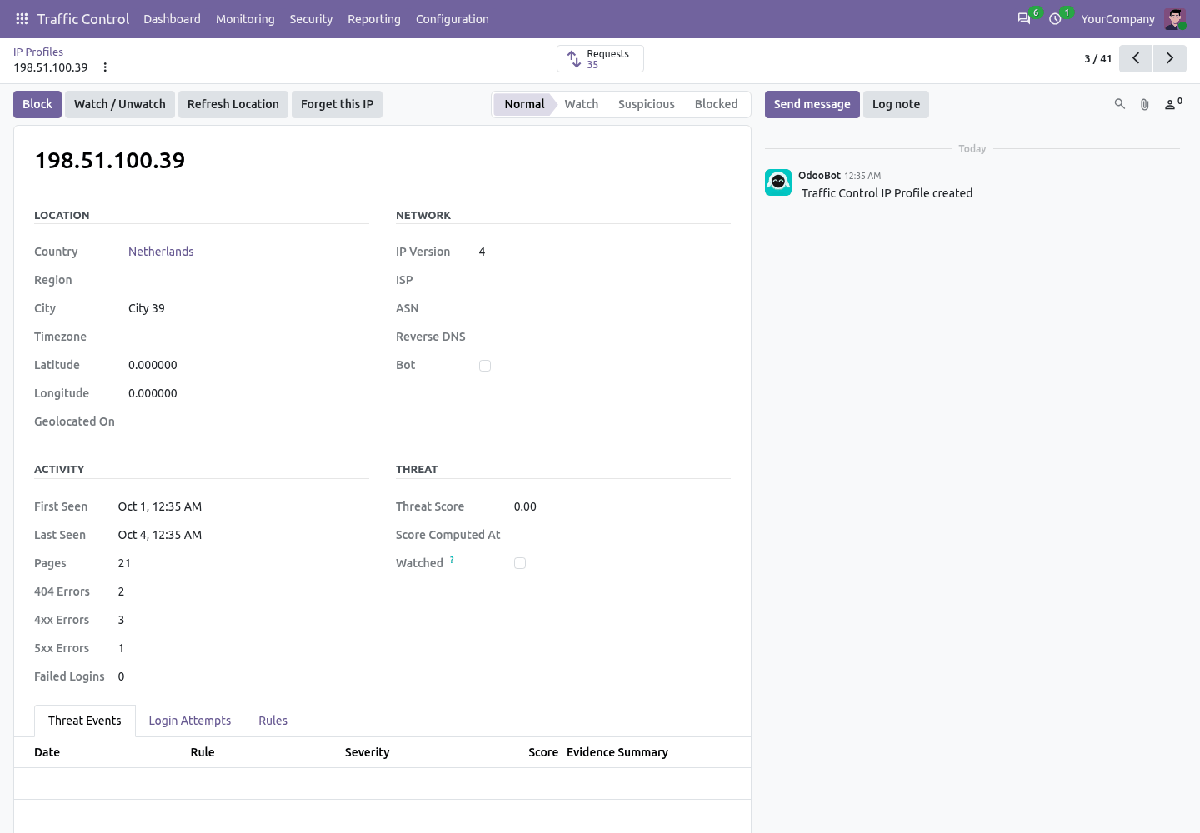
One IP profile
Decide the suggestions
Security → Suggestions. The module proposes; you decide.
Each suggestion carries its score, the rules that fired and the evidence.
Block for 15 minutes up to permanent, on the whole site or one part of it; or Watch, Allow-list, Dismiss.
Tick several and decide them together. The decision is written in the chatter.
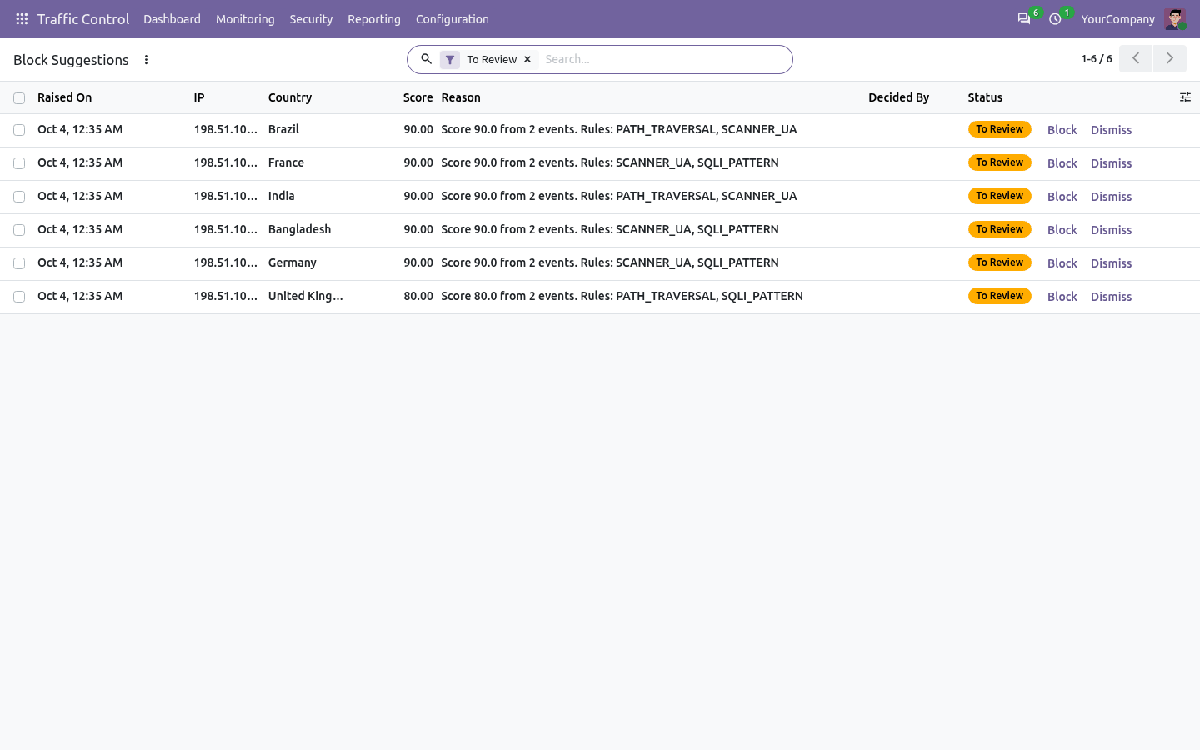
Suggestions waiting for a decision
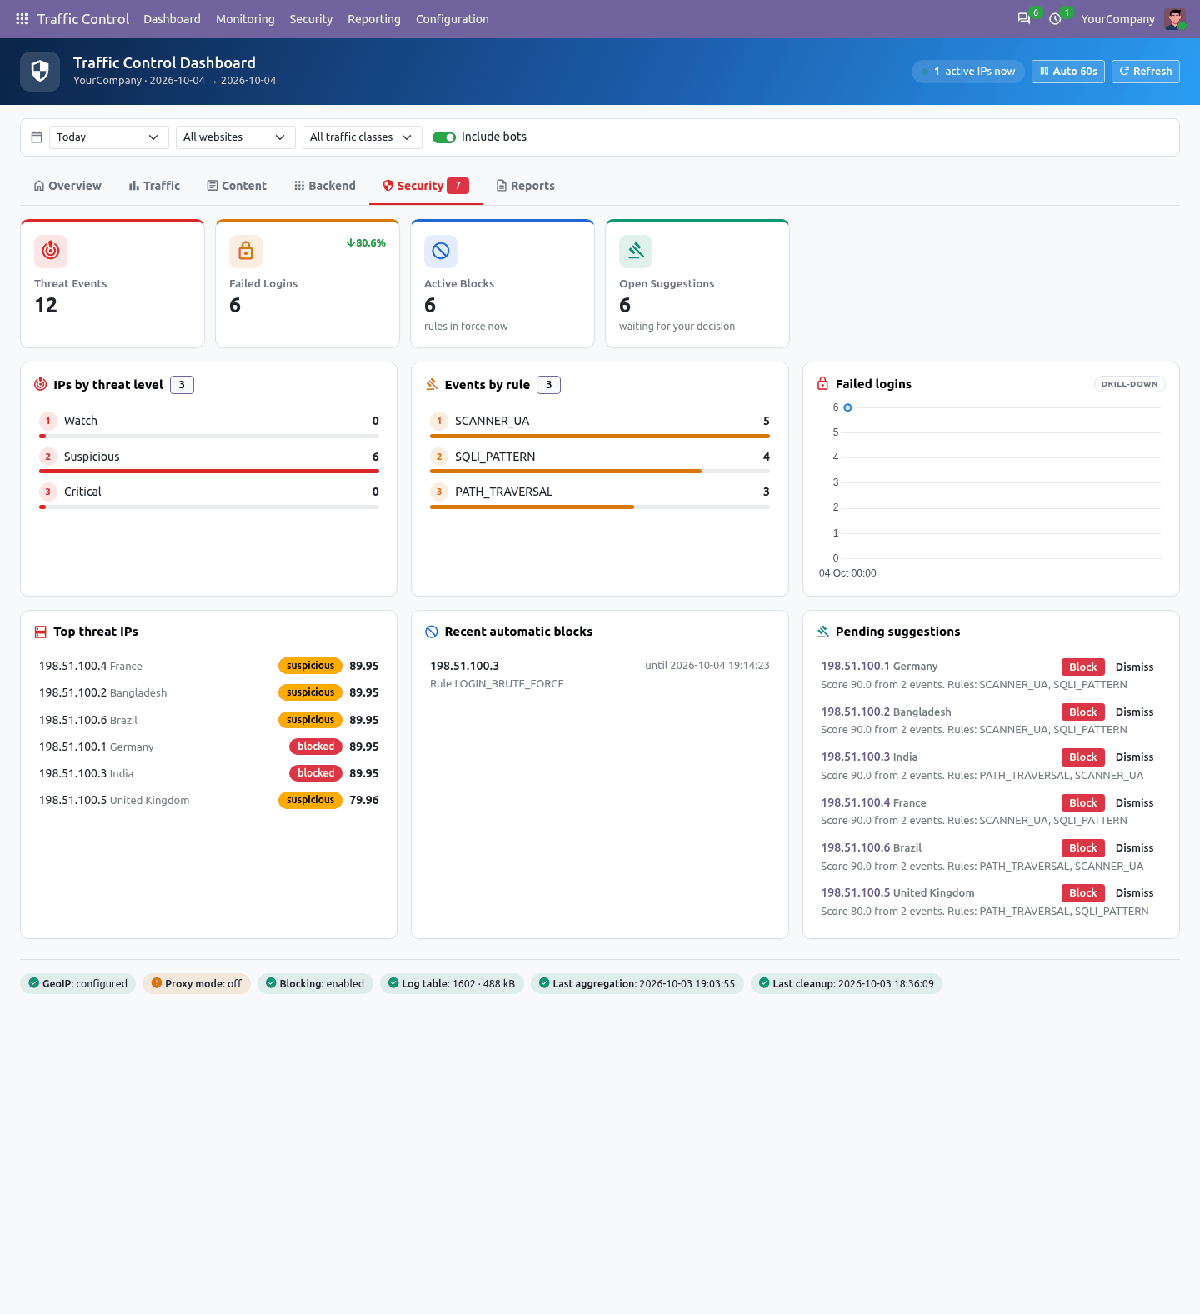
Security tab: decide in one click
Block an IP, a range or a country
Security → Block an IP, Range or Country.
Choose the action (403, 429 or log only), the scope and the duration.
Your own IP is shown; blocking it needs an explicit confirmation.
Rules that expire are archived automatically, so the history stays.
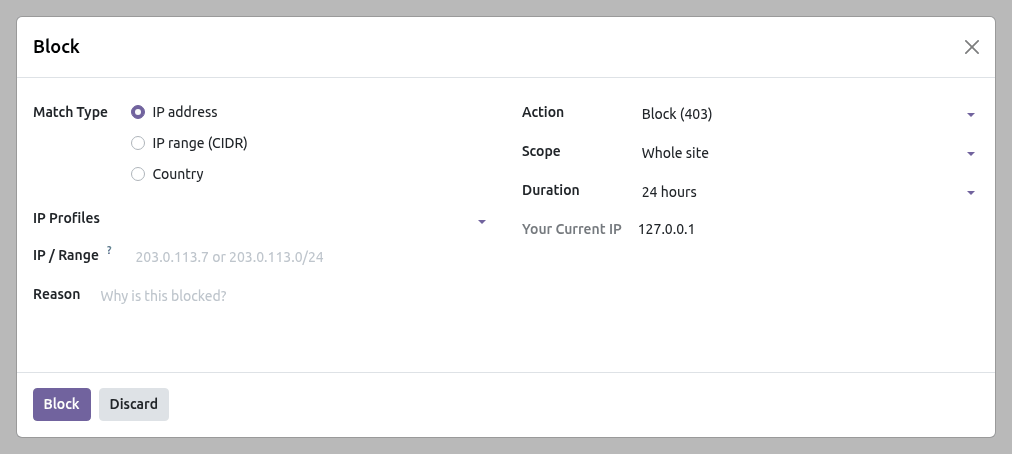
The Block window
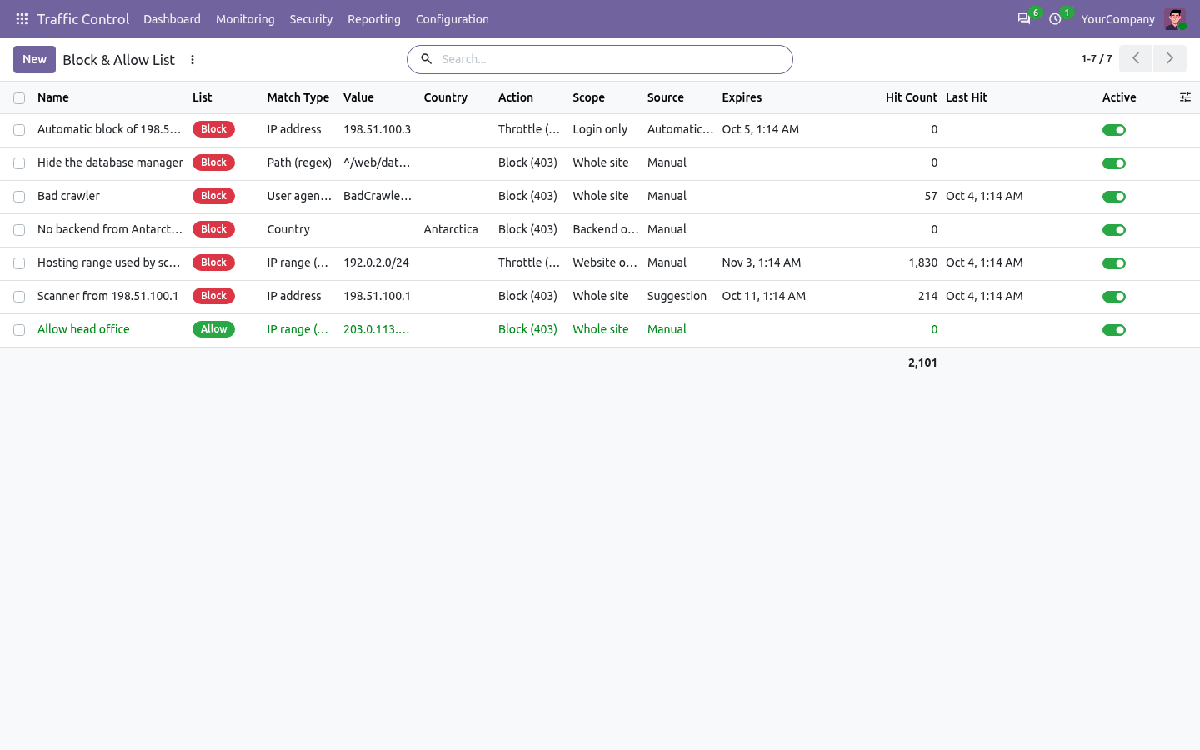
Block & Allow List with hit counts
Let login protection work
Nothing to do: it is on from installation.
Unknown logins and wrong passwords both count, on every channel.
The block is login-only by default, so the public website stays reachable.
Managers are notified, and after the last escalation step a permanent block is suggested rather than applied.
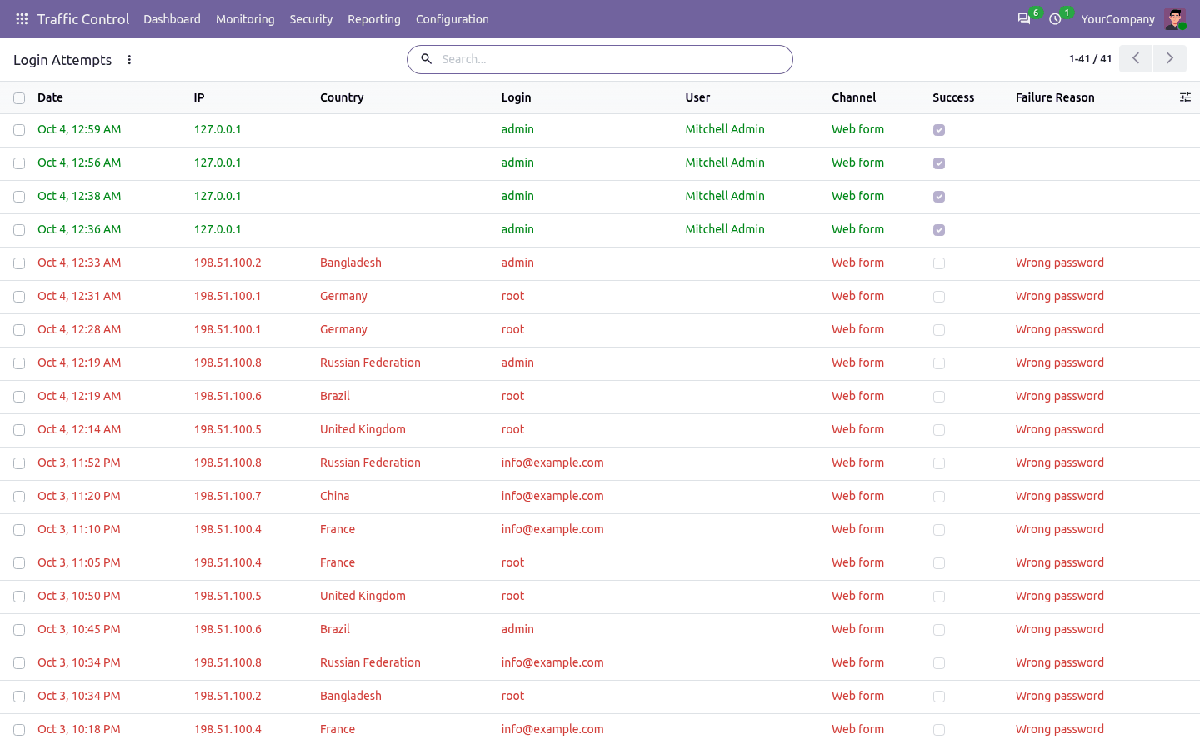
Every login attempt, never the password
Import and export lists
Security → Import IP List / Export Block List.
Import one IP or CIDR range per line from a text or CSV file; duplicates and invalid lines are reported.
Export as an nginx deny snippet, a plain list or CSV, to stop the traffic before it reaches Odoo.
Analyse and report
Reporting, or the dashboard's Reports tab.
Ten pivot / graph analyses reading pre-computed aggregates, so they stay fast after months of data.
Standard spreadsheet export from every pivot; raw log export by period.
Daily and weekly summary PDFs; the weekly one can be e-mailed to a group.
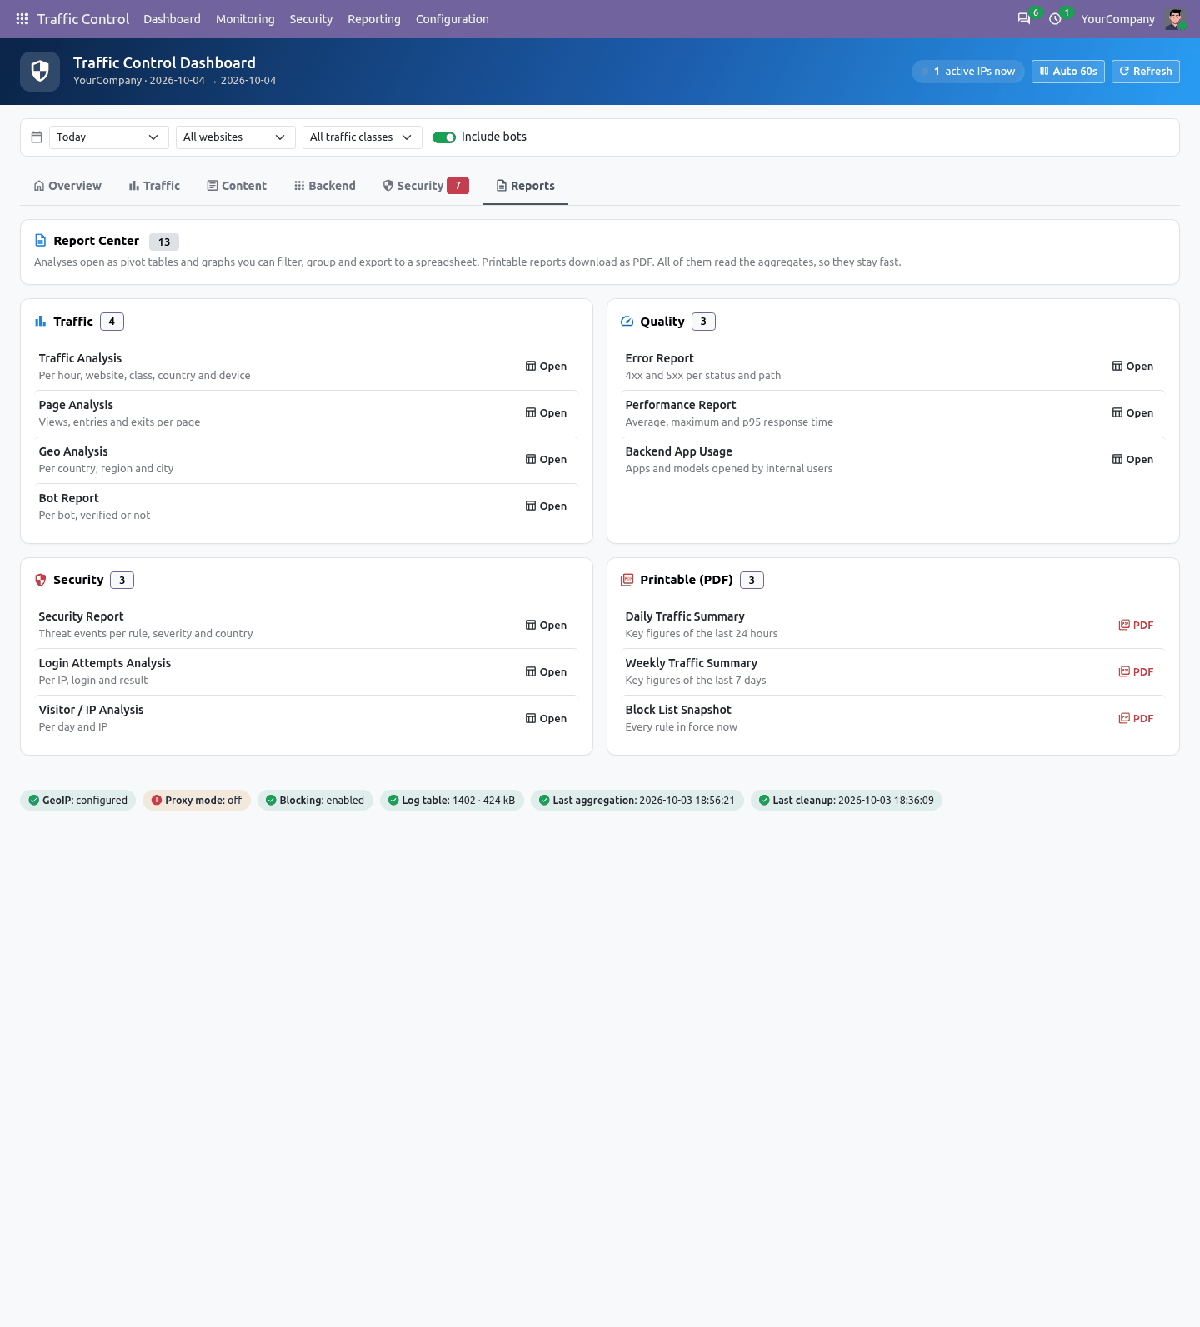
Report Center
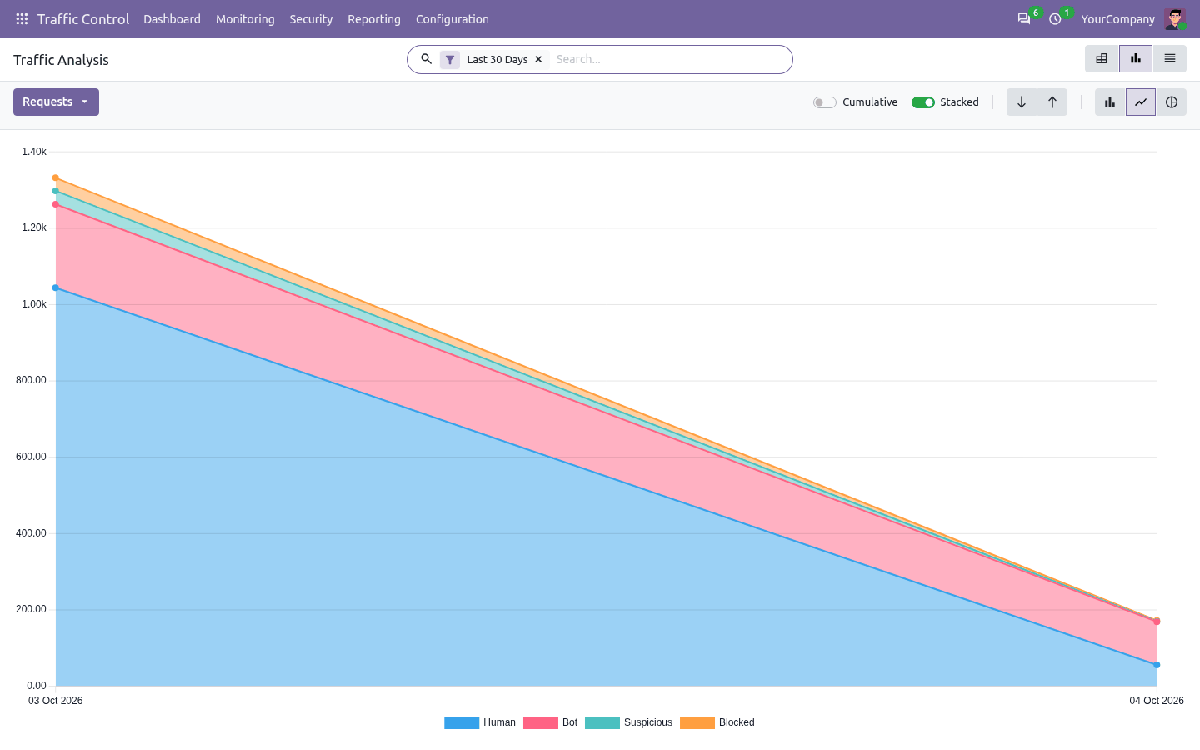
Traffic analysis
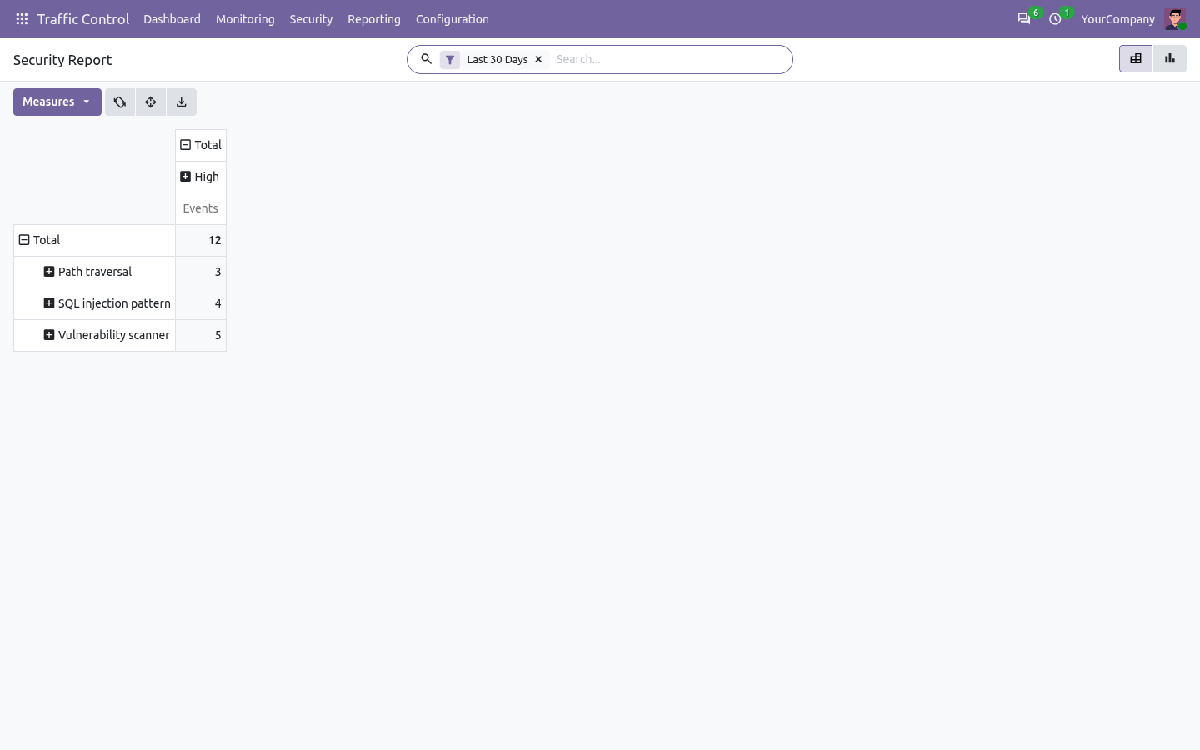
Security analysis
Three Roles — Only Managers Block
Access is declared on the access rights themselves. Public and portal users have no access at all to these models; the request pipeline writes with its own privileges on its own cursor.
13 Reports in Four Groups
Analyses open as pivot tables and graphs you can filter, group and export. They read hourly and daily aggregates built every 15 minutes, never the raw log.
Traffic (4)
Traffic analysis (hour, website, class, country, device), page analysis (views, entries, exits), geo analysis (country, region, city), bot report (verified or not).
Quality (3)
Error report (status and path), performance report (average, maximum and p95 response time), backend app usage (user, app, model).
Security (3)
Security report (rule, severity, country), login attempt analysis (IP, login, result), visitor / IP analysis per day.
Printable PDF (3)
Daily and weekly traffic summary, block list snapshot — plus a security incident report for any one IP.
Exports (4)
Spreadsheet export from every pivot, raw log CSV by period, block list as nginx snippet, plain list or CSV.
By e-mail (1)
The weekly summary PDF, sent to the group you choose.
Backend Activity — What Your Own Team Uses
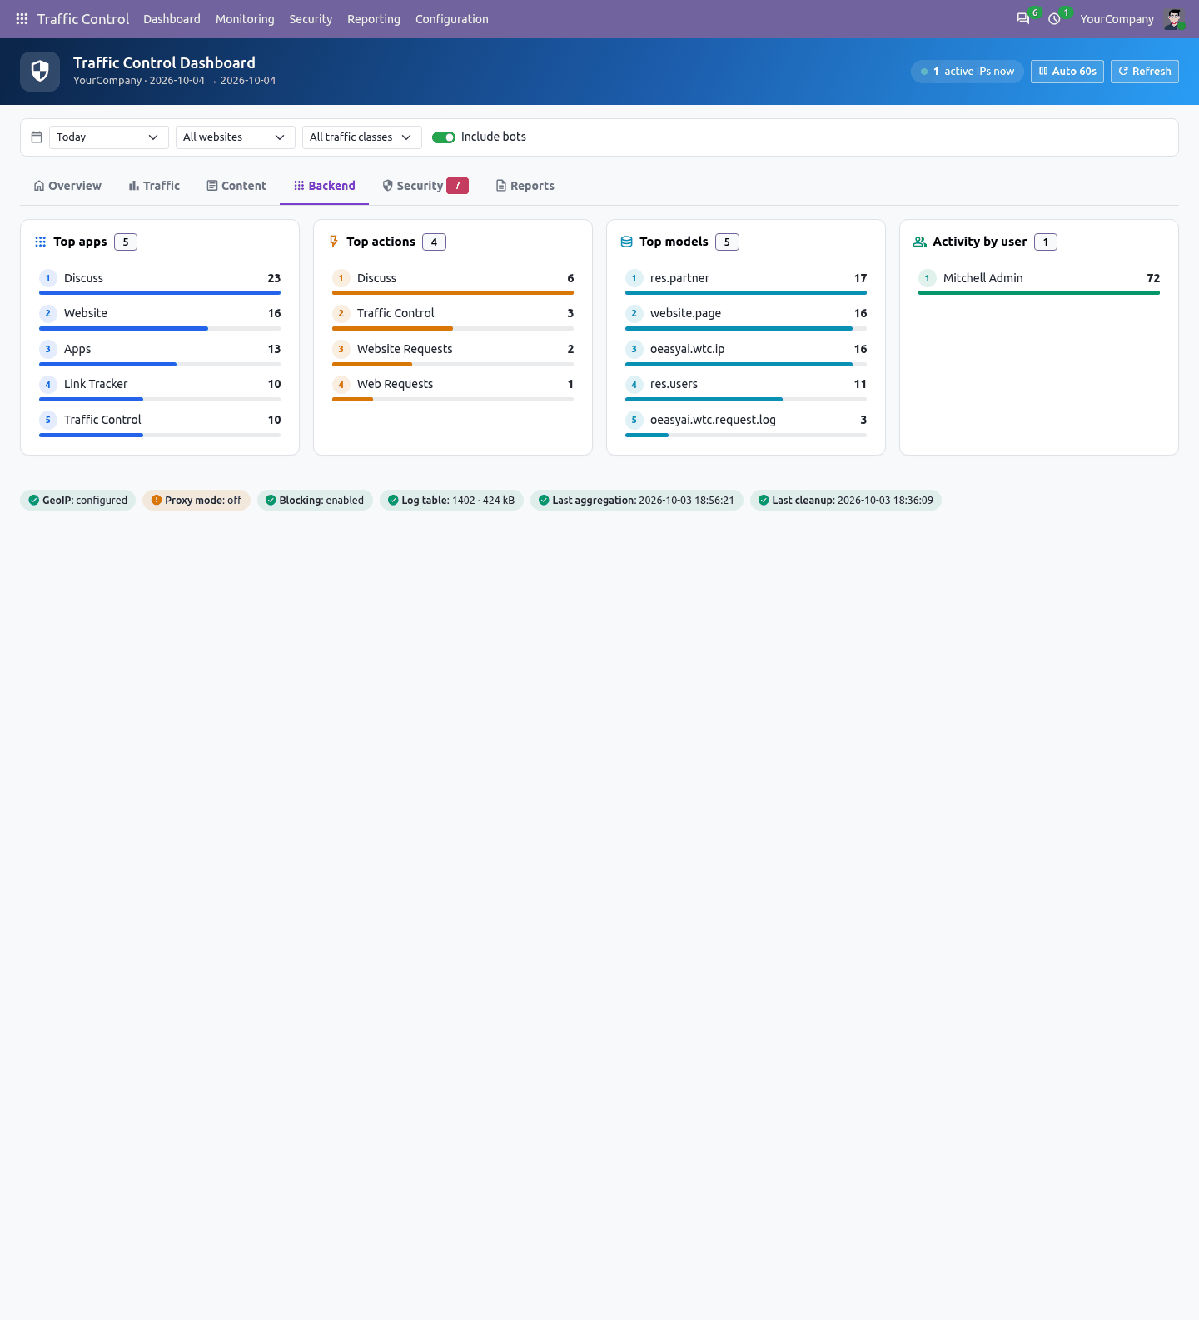
The Backend tab ranks the apps, actions and models your internal users open, and activity per user. Each row drills into the Backend App Usage analysis.
Printed Documents
Four PDFs, from the Reporting menu or the Print menu of a record.
Your Policy, Not Ours
Score thresholds and half-life, each rule's points and action, login limits and escalation, block scope, sampling, retention and anonymisation — all settings and editable records, not code.
Hard to Lock Yourself Out
The allow list is checked first. Private and loopback addresses are never blocked unless you ask. Blocking your own IP needs a confirmation. One system parameter switches all enforcement off from the shell.
Light on the Server
Block decisions are made in memory from cached rules. Log rows are one raw insert on a separate short transaction, with optional buffering and sampling. Counters live in an unlogged table shared by all workers.
Built on Odoo, Not Beside It
Uses Odoo's own GeoIP reader and the Website app's visitors instead of duplicating them. Standard list, pivot and graph views everywhere, so filters, favourites and exports behave as you expect.
Built to Fit Your Odoo
Odoo Community
Website, Discuss
Website
OPL-1
No Enterprise module is required. For locations, install the free MaxMind GeoLite2 databases and set geoip_city_db / geoip_country_db; no database is shipped with the module. Run Odoo behind a reverse proxy with proxy_mode = True, otherwise every visitor has the address of the proxy. A beginner's user manual (PDF) is included in the doc folder.
Deliberately not included: network-level DDoS protection (Odoo only sees traffic that passed the proxy — use the nginx export for that layer), logging of static files that the proxy serves directly, paid threat-intelligence feeds, and a world map (Odoo Community has no map widget; countries are shown as a ranked table with flags).
IP addresses are personal data under GDPR and similar laws. The module gives you anonymisation, retention and erasure tools; choosing settings that meet your own legal obligations remains your responsibility.
Support & Developer Details
For installation help, customization, extra threat rules, custom reports or implementation support, contact the maintainer.
Abdullah Al Arafat
+8801712192445
imbipul9@gmail.com